

Monitoring your docker containers using TIG stack with docker-compose
In the world of monitoring there are a lot of tools, sometimes gathered in stacks that make you possible to monitore your IT services from hardware to software. Basically these stacks help you to navigate through logs and datas produced by the different level of you IT services (hard, middle and software) and display them in a human readable way such as graph and dashboard.
One of these stack is Telegraf, InfluxDB and Grafana. Let's see how we can run these tools within a docker compose.
VM Configuration:
This example is running on the following VM configuation:
- Hypervisor: VirtualBox
- OS: Ubuntu 18.04
- RAM: 8GB
- CPU: 2
- Disk size: 10GB
Use case: How monitore docker's container ?
This example does not take into account security needs of a production environment !
The stack
Below some useful links:
In order to quickly understand the role of each component let's summurize them:
- Telegraf: Will be used as an agent that collects metrics from docker daemon
- InfluxDB: Will be our time series database that store all up coming datas from telegraf
- Grafana: Will be used to display our datas in pretty dashboards through a web interface.
Note: This a very quick sum up of these techs: for more information please consult the documentation
Requirements
To deploy the stack we will use the docker-compose CLI which relies on docker. So we will need both of them:
- Install Docker on ubuntu Other distros are available
- Install Docker compose
Here we go !
Let's build our stack step by step. As advised in the best practices it's is better to use a freeze version rather than the latest.
Note: want to know more about docker best practices ? See my article on it ;)
Prepare your workspace:
mkdir /home/$USER/TIG_workspace
cd /home/$USER/TIG_workspace
General configuration
- docker-compose version: 3.3
- 3 containers we will be created: one by service
- These three containers will need a dedicated network managed by docker. Let' so call it
TIG_net - As it is better to get use to name the container (notably for monitoring). We will follow this pattern:
TIG_<service>
Telegraf
Requirements:
- Docker image:
telegraf:1.19.3 - This container needs that the influx database is up and running
- We need to access the telegraf configuration file which is located in:
/etc/telegraf/telegraf.conf - We need to bind docker socket to the host machine to pull containers' data
- Restart strategy: We want the the container restart it self in case of unexepected crash.
Now we can translate these requirements in yaml instruction:
version: "3.3"
services:
  telegraf:
    image: telegraf:1.19.3
    container_name: TIG_telegraf
    depends_on:
      - influxdb
    restart: unless-stopped
    volumes:
      - "./telegraf/telegraf.conf:/etc/telegraf/telegraf.conf"
      - "/var/run/docker.sock:/var/run/docker.sock"
    networks:
      - TIG_net
Concerning the volume : before running the container we need to create the ./telegraf/telegraf.conf on the host side, otherwise docker will create telegraf.conf as directory and send an error when running the service:
# Go into your workspace
cd /home/$USER/TIG_workspace

# Create the telegraf directory
mkdir telegraf

# Get the config file with create a container from the telegraf:1.19.3 image
docker run  --rm telegraf:1.19.3 cat /etc/telegraf/telegraf.conf >> telegraf/telegraf.conf
Some explanations here:
docker run --rm telegraf:1.19.3: create a container from thetelegraf:1.19.3image and remove it once the process within it is overcat /etc/telegraf/telegraf.conf: overrite the entrypoint to display the default config file>> telegraf/telegraf.conf: send the output in the config file on the host.
InfluxDB
Requirements:
- Docker image:
influxdb:1.8 - InfluxDB is accessible through the 8086 port, this port will be used by Telegraf to send datas, and by Grafana to pull datas
- Environments variables are mandatory:
INFLUX_DBINFLUXDB_USERINFLUXDB_USER_PASSWORD
- Restart strategy: as we defined for telegraf
- We need a docker volume to store our datas
  influxdb:
    image: influxdb:1.8
    container_name: TIG_influxdb
    environment:
      INFLUX_DB: $INFLUX_DB
      INFLUXDB_USER: $INFLUXDB_USER
      INFLUXDB_USER_PASSWORD: $INFLUXDB_USER_PASSWORD
    ports:
      - 8086:8086
    restart: unless-stopped
    volumes:
      - "influxdb_volume:/var/lib/influxdb"
    networks:
      - TIG_net
_Notes:
- Concerning the volume, for telegraf's config file we use a bind mount, where we use a docker volume for influxdb. More information here
- Environment variables are stored in an aside
.envfile so that we are not displaying sensitve information like passwords
Grafana
Let's finish this configuration with Grafana requirements:
- Docker image:
grafana/grafana:8.1.2 - Restart strategy: as we defined for telegraf and influxdb
- Grafana is accessible through a web interface on port 3000, we want to access it from the host machine, so will bind it to the same port on the host.
- Environment variables are mandatory:
GF_SECURITY_ADMIN_USERGF_SECURITY_ADMIN_PASSWORD
- We need a docker volume to store grafana's data (such as plugins or afterwards dashboards)
  grafana:
    image: grafana/grafana:8.1.2
    container_name: TIG_grafana
    restart: unless-stopped
    ports:
      - 3000:3000
    environment:
      GF_SECURITY_ADMIN_USER: $GF_SECURITY_ADMIN_USER
      GF_SECURITY_ADMIN_PASSWORD: $GF_SECURITY_ADMIN_PASSWORD
    volumes:
      - "grafana_volume:/var/lib/grafana"
    networks:
      - TIG_net
The .env file
The last step is to create a .env file that will store our sensitive datas (such as passwords). Keep in mind that is not a production security level but it's way better than writing password directly in the docker-compose file.
Let's create it:
echo "INFLUX_DB=telegraf
INFLUXDB_USER=telegraf_user
INFLUXDB_USER_PASSWORD=telegraf_password

GF_SECURITY_ADMIN_USER=admin
GF_SECURITY_ADMIN_PASSWORD=grafana" > .env
Overview
Final yml file
Now we have a final configuration we can create and edit our docker-compose.yml file (using your favorite text editor).
We just need to add some docker instruction to tell docker daemon to add both influxdb and grafana volumes and the TIG_net network. We usually write these informations at the end of the file.
vim docker-compose.yml
version: "3.3"
services:
  influxdb:
    image: influxdb:1.8
    container_name: TIG_influxdb
    environment:
      INFLUX_DB: $INFLUX_DB
      INFLUXDB_USER: $INFLUXDB_USER
      INFLUXDB_USER_PASSWORD: $INFLUXDB_USER_PASSWORD
    ports:
      - 8086:8086
    restart: unless-stopped
    volumes:
      - "influxdb_volume:/var/lib/influxdb"
    networks:
      - TIG_net

  telegraf:
    image: telegraf:1.19.3
    container_name: TIG_telegraf
    depends_on:
      - influxdb
    restart: unless-stopped
    volumes:
      - "./telegraf/telegraf.conf:/etc/telegraf/telegraf.conf"
      - "/var/run/docker.sock:/var/run/docker.sock"
    networks:
      - TIG_net

  grafana:
    image: grafana/grafana:8.1.2
    container_name: TIG_grafana
    restart: unless-stopped
    ports:
      - 3000:3000
    environment:
      GF_SECURITY_ADMIN_USER: $GF_SECURITY_ADMIN_USER
      GF_SECURITY_ADMIN_PASSWORD: $GF_SECURITY_ADMIN_PASSWORD
    volumes:
      - "grafana_volume:/var/lib/grafana"
    networks:
      - TIG_net

networks:
  TIG_net:
    driver: bridge

volumes:
  influxdb_volume:
  grafana_volume:
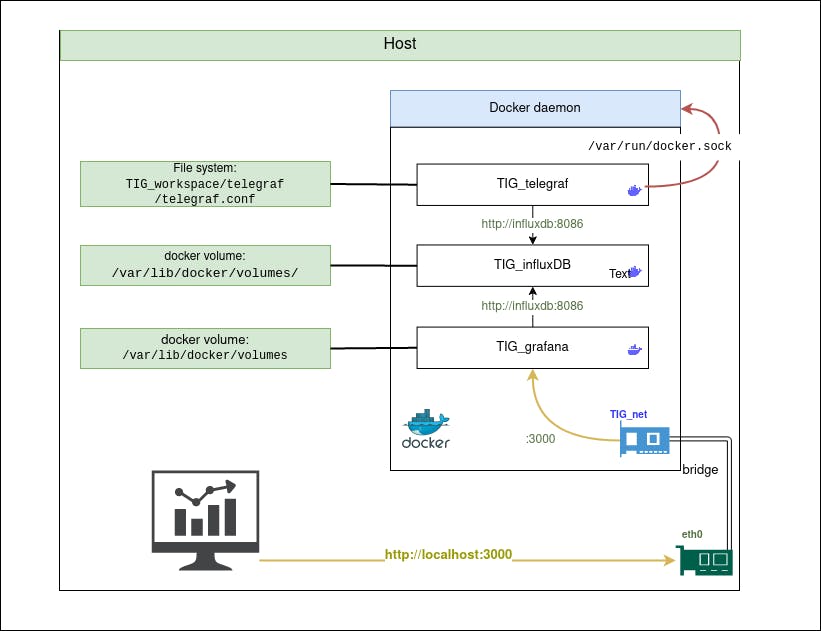
Representation of our architecture
Up the containers
Now our docker-compose.yml is ready, we can run the containers:
docker-compose up -d
Output:
Creating network "03_tig_TIG_net" with driver "bridge"
Creating volume "03_tig_influxdb_volume" with default driver
Creating volume "03_tig_grafana_volume" with default driver
Creating TIG_influxdb ... done
Creating TIG_grafana  ... done
Creating TIG_telegraf ... done
At any time you can check each service log
docker logs TIG_telegraf
Note: This feature can be very useful when debugging services in general. We can add -f to follow the log progression on your stdout.
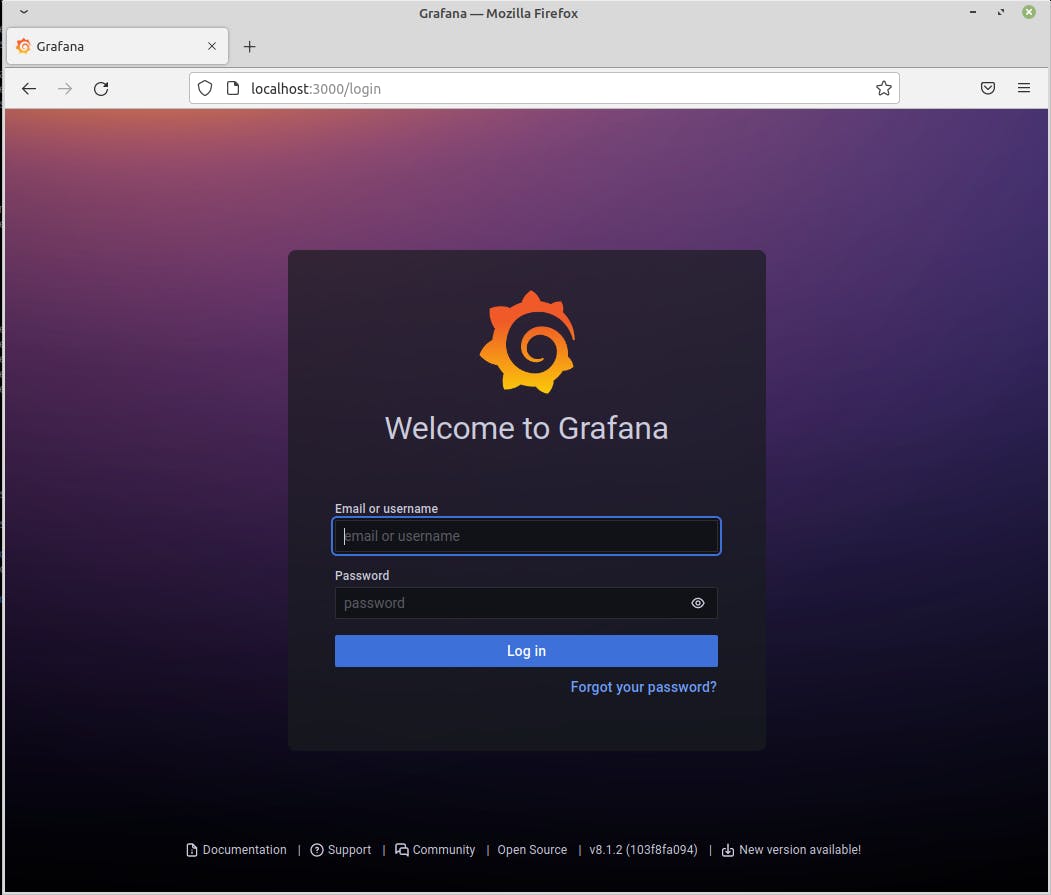
By now you should access your grafana server through this url: localhost:3000
Note: you can reach this server using the container IP address: 1. Get the container ip address:
docker inspect TIG_grafana | grep IP
Output
            "LinkLocalIPv6Address": "",
            "LinkLocalIPv6PrefixLen": 0,
            "SecondaryIPAddresses": null,
            "SecondaryIPv6Addresses": null,
            "GlobalIPv6Address": "",
            "GlobalIPv6PrefixLen": 0,
            "IPAddress": "",
            "IPPrefixLen": 0,
            "IPv6Gateway": "",
                    "IPAMConfig": null,
                    "IPAddress": "172.27.0.3",
                    "IPPrefixLen": 16,
                    "IPv6Gateway": "",
                    "GlobalIPv6Address": "",
                    "GlobalIPv6PrefixLen": 0,
2. Connect to http://172.27.0.3:3000 (in my case)
Telegraf configuration
By now our containers are up and running but no datas from Docker are collected.
Go in the telegraf config file and edit it, as the volume has been bind there is no need to exec anything in the TIG_telegraf container. Simply edit the telegraf config file on your host:
vim /home/$USER/TIG_workspace/telegraf/telegraf.conf
Note:
- The
telegraf.conffile is quite long (~ 8000 lines !) I won't display it here. When navigate through this file you can find out a dedicated section for and docker. - If your at ease with
vimgo ahead, else you should use your favorite text editor (regarding the file's amount of line)
Inputs section
Docker section extract:
 [[inputs.docker]]
   ## Docker Endpoint
   ##   To use TCP, set endpoint = "tcp://[ip]:[port]"
   ##   To use environment variables (ie, docker-machine), set endpoint = "ENV"
   endpoint = "unix:///var/run/docker.sock"

   ## Set to true to collect Swarm metrics(desired_replicas, running_replicas)
   gather_services = false

   ## Only collect metrics for these containers, collect all if empty
   container_names = []

   ## Set the source tag for the metrics to the container ID hostname, eg first 12 chars
   source_tag = false

   ## Containers to include and exclude. Globs accepted.
   ## Note that an empty array for both will include all containers
   container_name_include = []
   container_name_exclude = []
...
Here we will use endpoint = "unix:///var/run/docker.sock" to pull datas from the container (remember when we binded the docker socket on TIG_telegraf container ?)
Note:
- It's definitely worth spending five minutes reading the docker section to understand how it works
- In these case, documentation can be very useful: docker input doc
Output section
As we did for docker's input section let's configure the output which is going to be influxdb
[[outputs.influxdb]]
  ## The full HTTP or UDP URL for your InfluxDB instance.
  ##
  ## Multiple URLs can be specified for a single cluster, only ONE of the
  ## urls will be written to each interval.
  # urls = ["unix:///var/run/influxdb.sock"]
  # urls = ["udp://127.0.0.1:8089"]
  urls = ["http://influxdb:8086"]
Note: here we modified the last url with urls = ["http://influxdb:8086"], in fact docker can manage domain name within the docker-compose.yml file
Check data in influxdb
To check datas are pulled to influxdb we can use the influxdb CLI from the TIG_influxdb container:
docker exec -it TIG_influxdb influx
Here some output:
> show databases
name: databases
name
----
_internal
telegraf

> use telegraf
Using database telegraf

> show measurements
name: measurements
name
----
cpu
disk
diskio
docker
docker_container_blkio
docker_container_cpu
docker_container_mem
docker_container_net
docker_container_status
kernel
mem
processes
swap
system
Note: more information about influxdb CLI here, syntax is similare to SQL
Configure Grafana
Set up database
Now that datas are pulled from vshere and docker, we will set grafana so that it will be able to display them in pretty dashboard
Go to localhost:3000
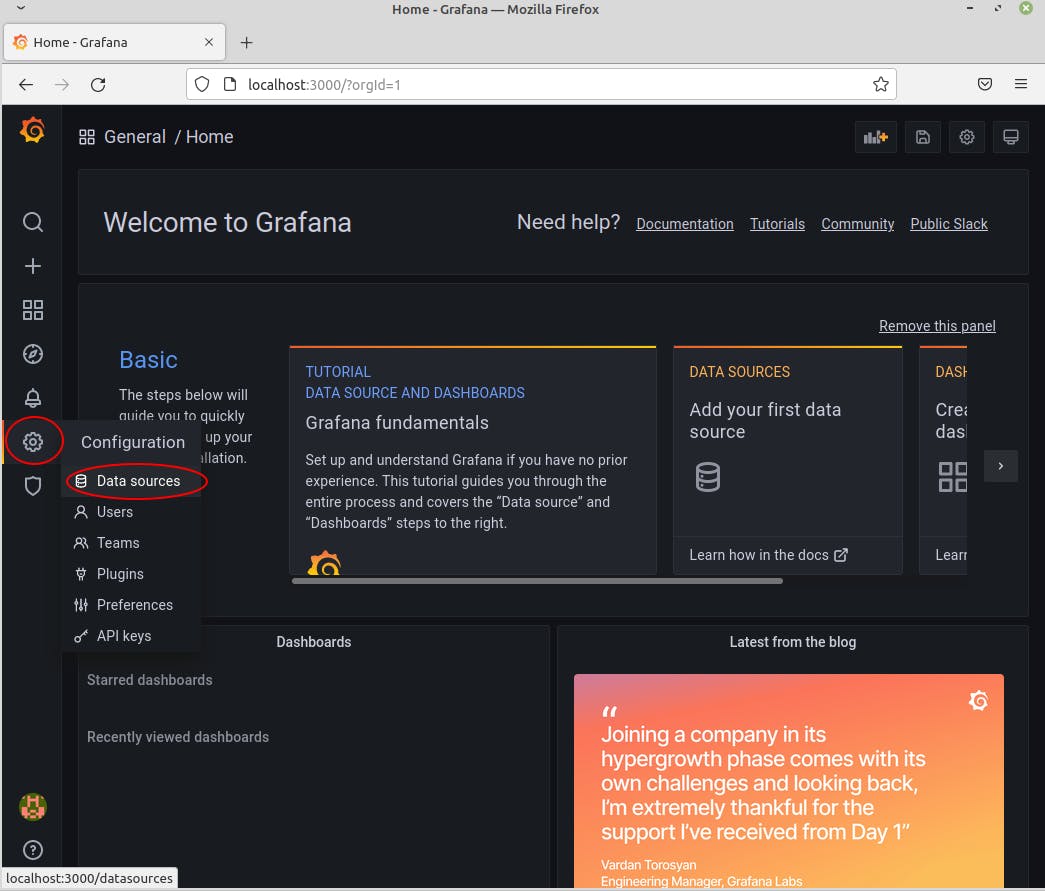
Go in the Configuration section (gear on the left pannel) and data sources
Click on Add data source and select influxDB. You should reach the InfluxDB configuration, feed it with:
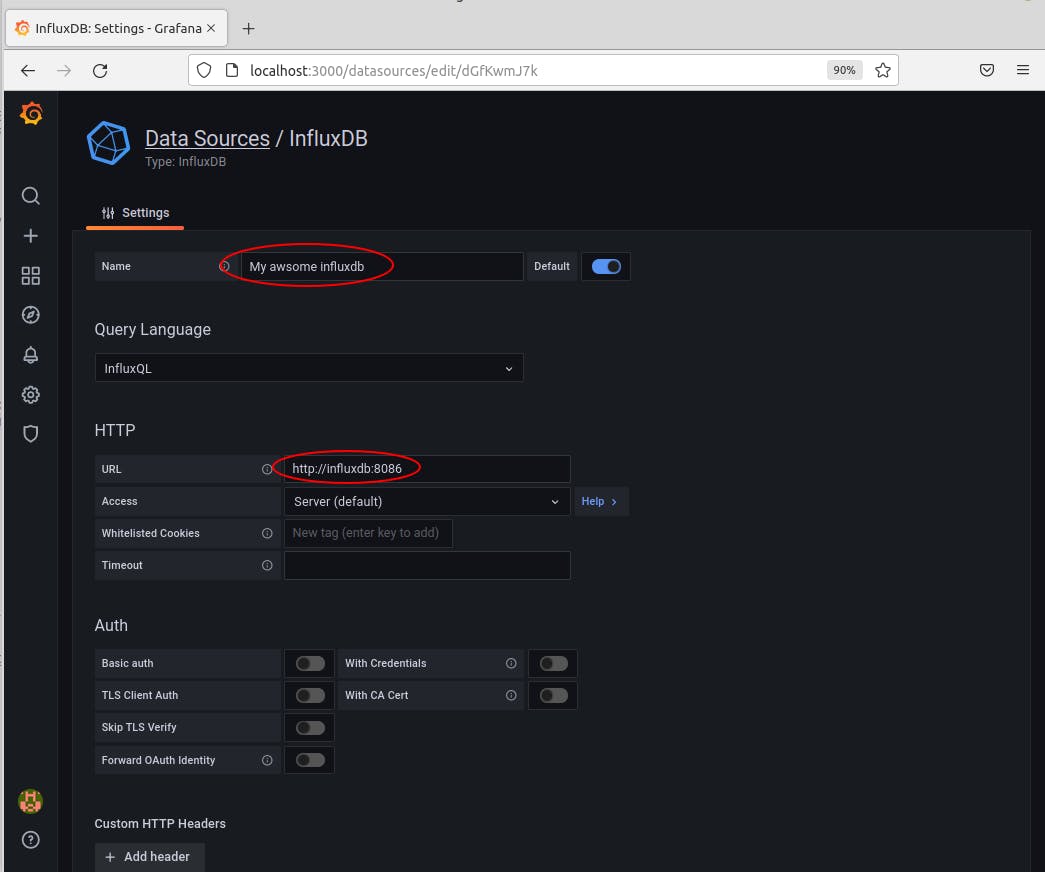
(scroll down)
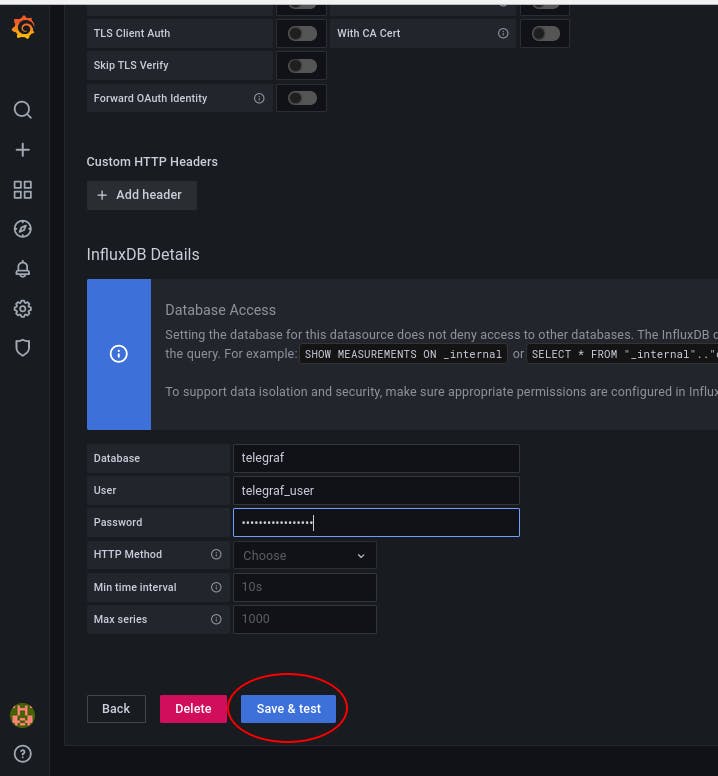
Write down the credential (they are in the .env in case you forgot) and click on Save & test
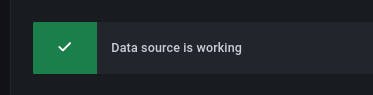
This mean everything went well:
Import a complete dashboard
A community is designing dashboard through different use case. One them will interest us: The docker one
Let's import it through the grafana interface:
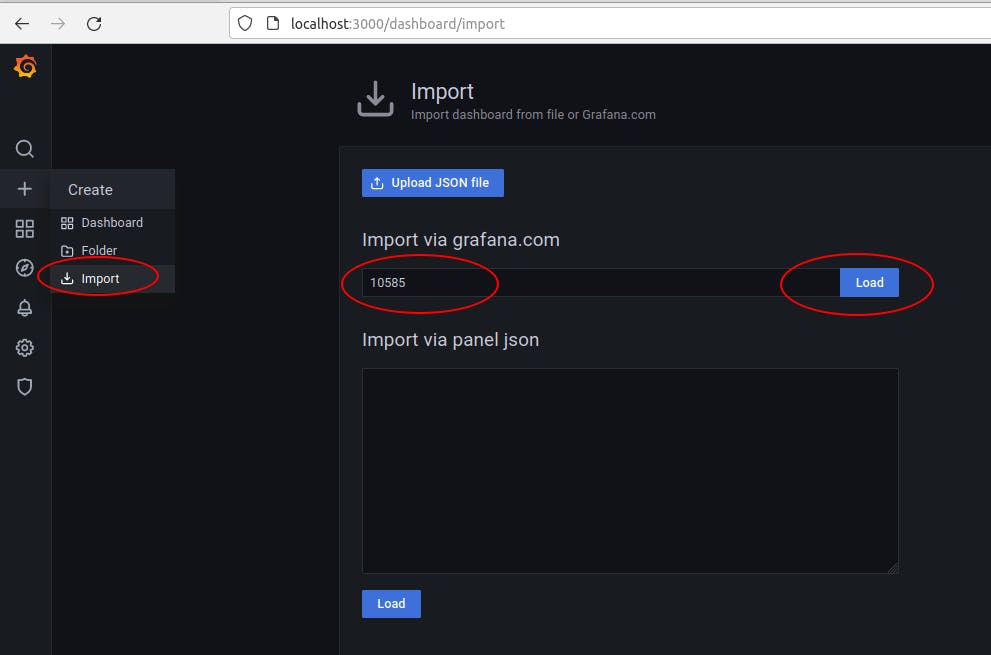
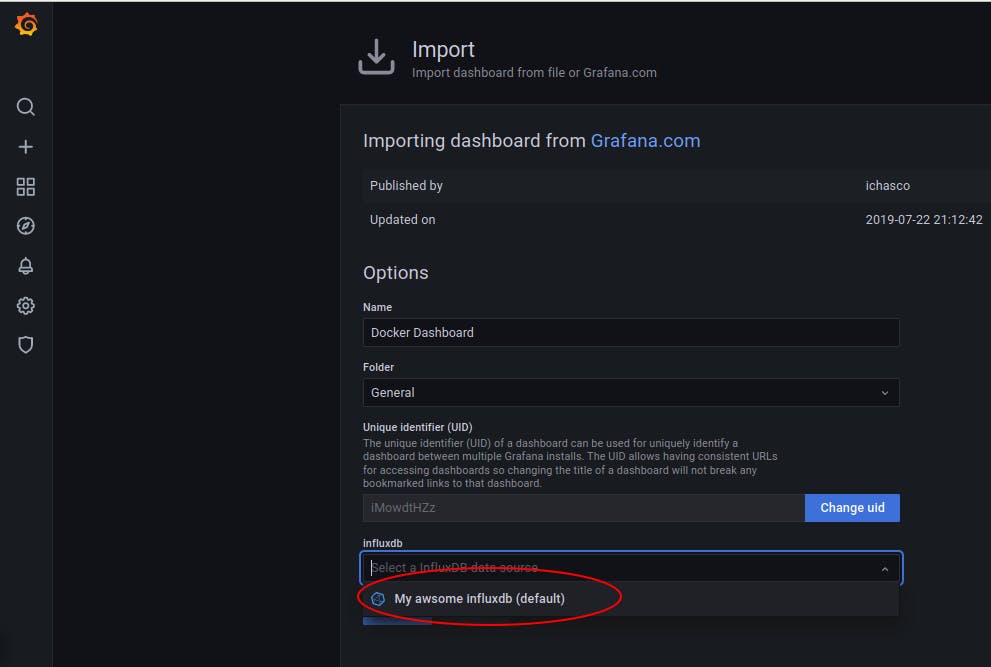
Then on the left Pannel go to Dashboard/Manage and click the Docker Dashboard
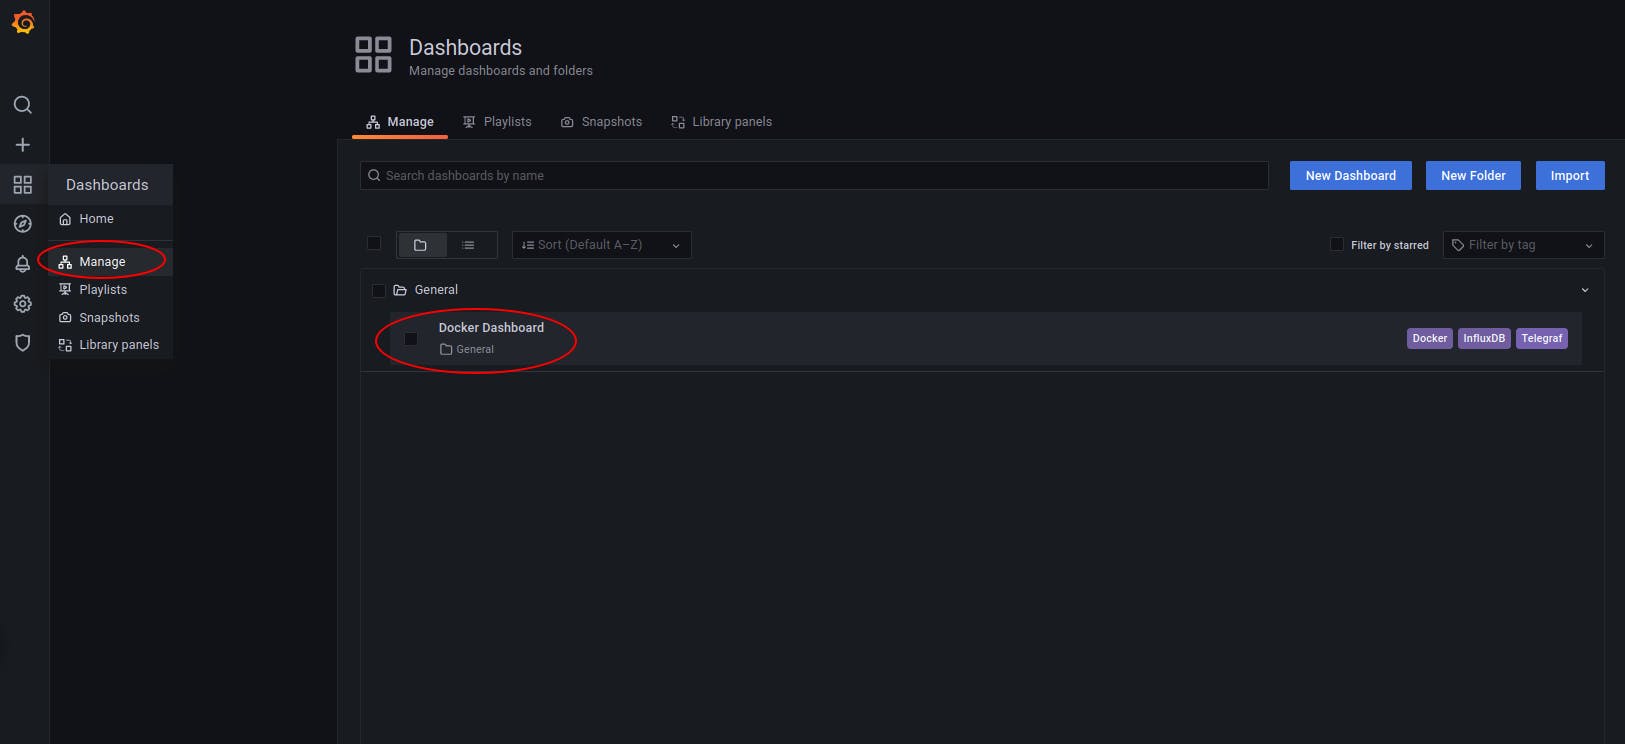
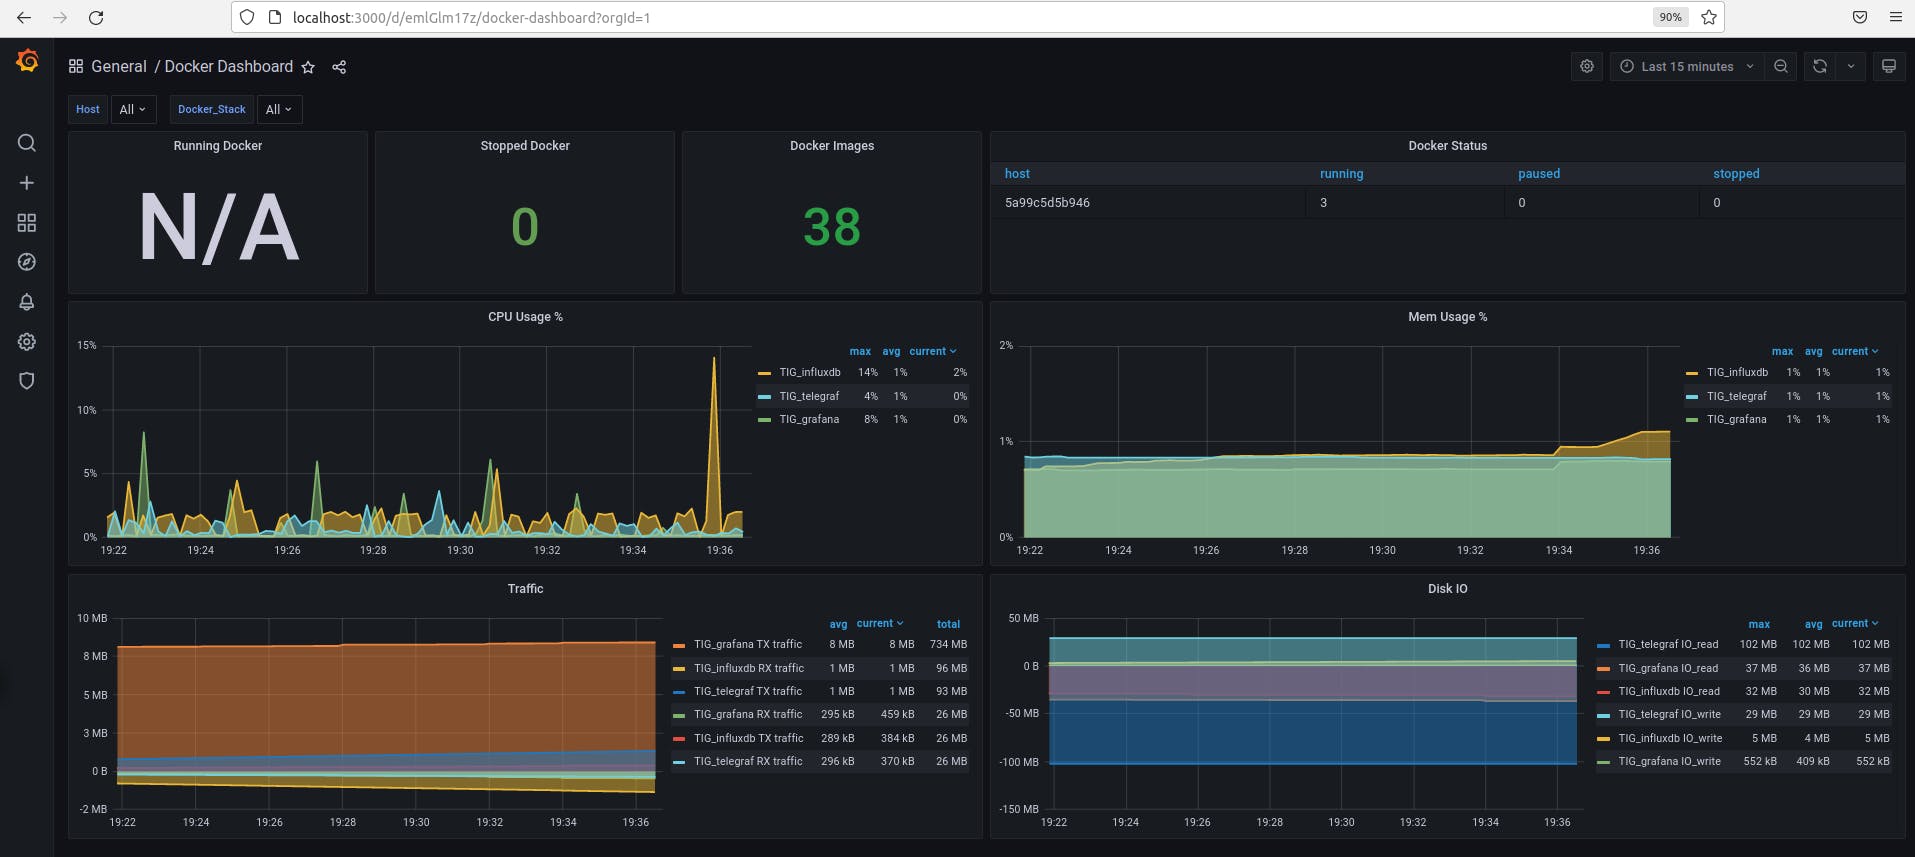
Enjoy your pretty dashboard ;)
Trouble shot
Cannot connect with admin/admin password with grafana on localhost:3000
Reset your passord using the grafana CLI. Without using a container the command is grafana-cli --homepath "/usr/share/grafana" admin reset-admin-password <new password>. Let's execute within our container
docker exec -it TIG_grafana grafana-cli --homepath "/usr/share/grafana" admin reset-admin-password admin
The output:
INFO[01-09|17:00:42] Connecting to DB                         logger=sqlstore dbtype=sqlite3
INFO[01-09|17:00:42] Starting DB migrations                   logger=migrator
INFO[01-09|17:00:42] migrations completed                     logger=migrator performed=0 skipped=330 duration=983.026µs